[wp_tech_share]

Part 2 of a 3-Part CNaaS Blog Series: Focusing on Enterprise Needs, the Three CNaaS Variants Become More Than Solutions Looking for a Problem

Campus NaaS is poorly defined in the industry, leading to market confusion. In this series of blogs, Siân Morgan explores the differences and similarities of the offers on the market and proposes a set of definitions to help enterprises and vendors speak the same language.

The first danger sign came when Henry Ford named the Edsel, Ford Motor Company’s ambitious new car concept, after his son. The idea for a premium mid-market car was laden with high expectations, and after ten years and $250 million spent planning, the Edsel was launched with fanfare in September 1957. Three months later, sales plummeted. Ford had projected it would sell 200,000 Edsel cars a year.  Instead, 118,287 were sold over the three years the Edsel was in production.  Ford had misunderstood what customers wanted.

In the first blog of this series, we defined the technological characteristics of CNaaS, but bearing in mind the Edsel backfire, it is important to address the way CNaaS fulfills real customer needs.

All of these offers are focused on two common customer requirements:

    1. The increasing complexity of Local Area Networks, coupled with a lack of skilled IT resources.

This requirement has been amplified by the recent wave of AI innovation. Most enterprises are focused on developing an AI roadmap, and many would prefer to reallocate resources from maintaining the LAN to higher-value projects.

    1. Enterprises’ desire to reduce capital expenditures while prioritizing IT investments.

Typical CNaaS offers include hardware financing that allows LAN hardware, software and services to be bundled into one recurring fee. Some enterprises may find the opex price structure alluring because it helps with cost allocation, better matches the company’s revenue streams, or fits better with funding cycles. However, companies that are measured or restricted by financial covenants based on their EBITDA, or entities that are prevented from committing to multi-year contracts, will prefer to purchase their LAN equipment outright. To cater to these enterprises, some CNaaS vendors have structured their pricing to appear as capital leases on enterprises’ books. Other CNaaS vendors have the option of a capex acquisition model.

The three CNaaS variants address enterprises IT requirements in different ways

To match the multitude of CNaaS options, vendors have approached the service from different angles. Among the offers available, it is possible to classify them into three categories, based on the vendors’ business objectives outlined in Figure 1.


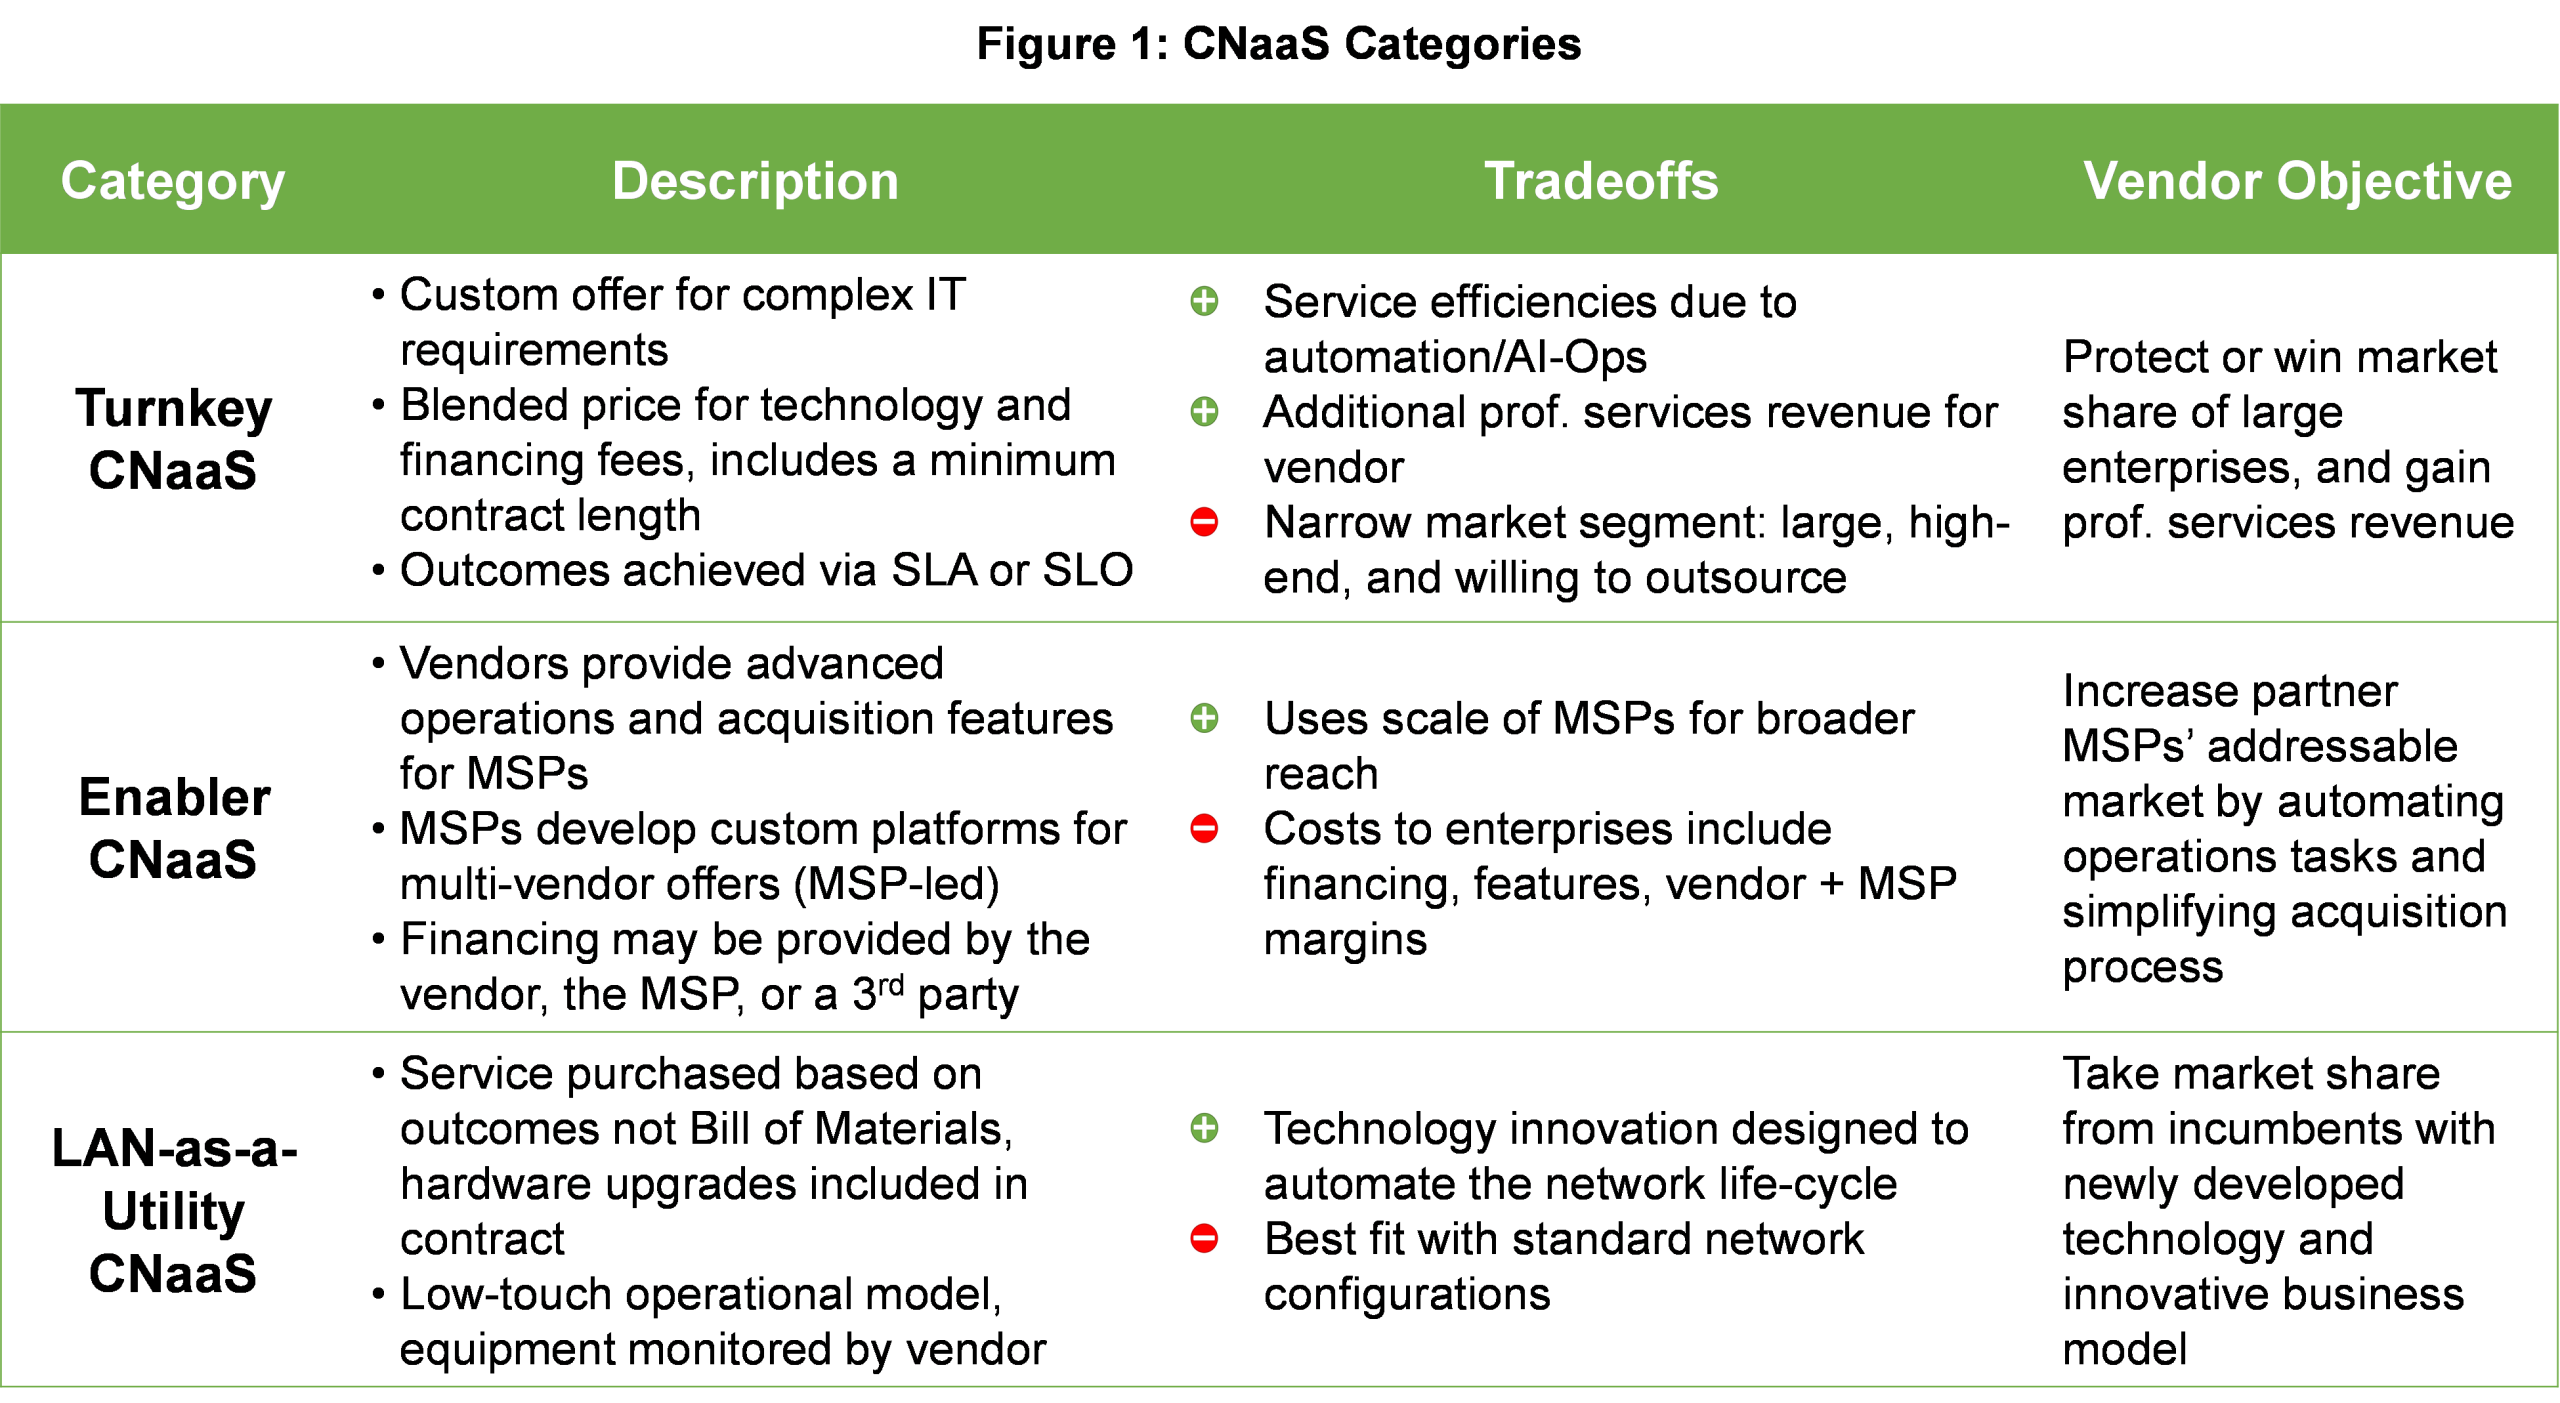
Turnkey CNaaS—Led by Large Vendors
    • Who offers it: Large, incumbent vendors with broad portfolios are well-placed to offer this type of “high-touch” offer, targeting large enterprises directly and without the support of an MSP.
    • How it works: These offers can be financed by the vendors such that service price is aligned with an enterprise’s business model. For instance, a vendor could blend and distribute the service price to fluctuate in step with the enterprise’s cyclical revenue. The price could also be structured to match the geographic distribution of an enterprise’s revenue centers.

    • Market impact: This type of offer has a more traditional delivery model than the other two CNaaS categories.  Turnkey CNaaS was responsible for virtually all of CNaaS revenue in 2020 and was the largest category of CNaaS revenue in 2024.


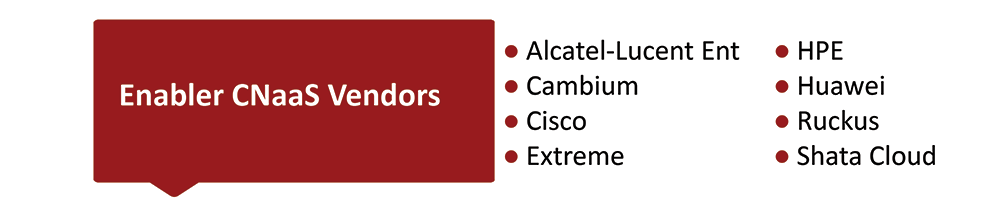
Enabler CNaaS—Scaling Through MSPs
    • Who offers it: Enabler CNaaS is typically offered by incumbent LAN equipment vendors that maintain deep channel relationships with MSPs. Unlike Turnkey CNaaS, the vendor keeps the vendor–MSP partnership intact.  Exceptionally, Shasta Cloud is a startup in this category.  Shasta leverages TIP’s OpenLAN initiative and requires a service provider or partner to label and deliver the offer to customers.
    • How it works: The innovation lies in the business model. Vendors develop tools to simplify acquisition and may finance the hardware. This helps the MSPs to bundle professional services with vendor hardware and software, creating a more attractive package for enterprises. Even without explicit support from vendors, MSPs can build their own version of CNaaS, which we label “MSP-Led”.  This approach often involves in-house development from an MSP.
    • Market examples: This category of CNaaS is made up mainly of incumbent LAN equipment vendors leveraging existing MSP relationships.

    • Market impact: We expect Enabler CNaaS to comprise most of CNaaS revenue from 2026 to 2029. MSPs are established globally and have the capability of scaling up the sales of these solutions to mid-to-large enterprises quickly, once they commit to selling opex-structured offers.


LAN-as-a-Utility— A New Model for Campus Networks
    • Who offers it: Whereas the innovation of Turnkey and Enabler CNaaS offers is centered on the business model and acquisition process, LAN-as-a-Utility vendors have developed entirely new hardware and software designed to automate network delivery and operations.
    • How it works: Initially, most LAN-as-a-Utility offers were acquired by enterprises directly from vendors, and purchased based on a standard, outcome-oriented price per area or number of connected devices. Because LAN-as-a-Utility offers are designed to automate the day-to-day monitoring of enterprise network equipment, they risk reducing business opportunities for MSPs. However, MSPs are also valuable routes to market for LAN-as-a-Utility vendors. For this reason, there has been a gradual shift in the relationship between the LAN-as-a-Utility vendors and channel partners, with the vendors allowing the partners to take on more of the initial design and site surveys, as well as ongoing network monitoring.

As the LAN-as-a-Utility vendors have become more established, their approach to pricing has also evolved. As the vendors encountered a diverse set of enterprises with different needs, they began presenting a more nuanced pricing approach, with custom pricing depending on location, space and enterprise requirements.

    • Market examples: Each of the four most active vendors in this category includes different components in their offers; however, all are involved in developing in-house software and in monitoring the networks on an ongoing basis.

    • Market impact: LAN-as-a-Utility vendors are challenging the established IT equipment industry. These offers resonate best with small-to-mid sized enterprises that have very small, or non-existent, IT teams.  By outsourcing the network and its monitoring with the protection of an outcome-oriented SLA (Service Level Agreement), these enterprises can obtain a high-quality network without the associated labor costs and without large outlays of capital. LAN-as-a-Utility CNaaS vendors now report that a significant number of their deals are arriving via channel partners. However, it will take time for these newcomers to build a channel presence as large as the incumbent vendors.  Although this variant of CNaaS has the smallest share of revenue out of the three variants, it also has the most impressive growth rate.

Turnkey, Enabler and LAN-as-a-Utility CNaaS are all different offers, leading to a variety of customer experiences.  However, they are all delivered with public cloud-managed equipment, and with automation as a central feature.  The CNaaS construct represents three different ways to address enterprises’ need for IT simplification.

Which of the three is likely to be more successful?  How big is the overall market? These questions will be addressed in the final blog of this three-part series.

Dell’Oro Group Tracks CNaaS Trends, Market Dynamics and Revenue Forecasts in the Advanced Research Report: CNaaS and Public Cloud-Managed LAN

[wp_tech_share]

Spoiler alert: it is not hype. But before we answer the question definitively, let’s define T-Mobile’s “Edge Control” just recently announced October 20, 2025. At Dell’Oro Group, we would call it an MNO-provided Private Network (MPN) as shown.

MNO-provided 5G SA Mobile Private Network (MPN)

Multi-Access Edge Computing (MEC) nodes are distributed across enterprise campuses, housing the User Plane Function (UPF) of the 5G Core, as well as the servers for data storage and computing specific to the enterprise. The Control Plane, however, remains on the MNO’s property at a regional data center. This design is referred to as Private MEC. The illustration also shows Public MEC, which can be geographically dispersed MEC nodes to address use cases requiring low latency and broad geographic coverage beyond the limits of an enterprise campus.

Why compare to China? Well, Chinese MNOs have been using a similar network architecture since launching their 5G Standalone (SA) networks in 2020. By the end of 2024 the MNOs in China had implemented 55,000 MNO-provided Private Networks. Based on their success in China, we expect T-Mobile will achieve proportional success in the U.S. market.

In addition, the vendors supplying MEC infrastructure equipment and application solutions should enjoy similar success as reported in our Mobile Core Network (MCN) and MEC Report – 2Q25.


Dell'Oro - China MEC Market by MNO-provided Mobile Private Network

[wp_tech_share]

After two consecutive years of declining telecom equipment investments, the pendulum is beginning to shift. Preliminary findings indicate that aggregate worldwide telecom equipment revenues across the six programs tracked by Dell’Oro Group—Broadband Access, Microwave & Optical Transport, Mobile Core Network (MCN), Radio Access Network (RAN), and Service Provider Router & Switch—increased by 4% year over year (Y/Y) in 1H25. The improved market conditions were driven by several factors, including easier year-over-year comparisons, inventory stabilization, and favorable currency movements.

Market conditions improved markedly outside of China, with revenues increasing 8% Y/Y in the first half. The recovery was broad-based across all telecom programs; however, it is worth noting that MCN, Optical Transport, and SP Router & Switch led the gains.

Global supplier rankings remained largely unchanged, though revenue shares shifted modestly as Huawei continued to gain ground, while Ericsson and Nokia saw slight declines compared with 2024 levels.

The short-term outlook has been revised slightly upward. The analyst team now expects global telecom equipment revenues across the six programs to grow 2% to 3% in 2025, compared with a flat outlook in the 2024 update.

[wp_tech_share]

In our 2Q 2025 Mobile Core Network (MCN) and Multi-access Edge Computing Report (MEC), we estimated manufacturing revenues by 5G Core vendors at a 31 percent year-over-year growth rate. At the same time, we announced that 71 Mobile Network Operators (MNOs) have commercially launched enhanced Mobile Broadband (eMBB) services to consumers.

As an industry, we have been bemoaning the slow uptake of 5G SA networks by MNOs. After all, we are in the sixth year of the 5G SA era, and with over 700 MNOs in the world, it is surprising that more 5G SA networks have not launched.

So why the acceleration in the 5G SA core space despite only 10% of the MNOs having launched 5G SA?

First, let’s look at the MNOs that have launched 5G SA eMMB networks for consumers.

The 40 countries/territories, with at least one MNO, can provide service to over 55% of the world’s population. At the same time, only 14% of the world’s mobile subscribers had 5G SA services at the end of 2024 (per Ericsson Mobility Report, June 2025). The conclusion one can draw from this is a low penetration rate of 5G SA subscribers from the 71 MNOs offering 5G SA services. The Chinese MNOs have been very aggressive in building out 5G SA coverage, and China Mobile, as an example, has achieved 60% 5G SA subscriber penetration after their launch in 2020. China Mobile’s 5G SA penetration rate is the best-case scenario for a large Tier-1 MNO. But even so, they still have many subscribers who can migrate from 4G to 5G. As the existing 5G SA networks mature in coverage and new, lower-cost handsets become available, with attractive incentives by MNOs to upgrade to 5G SA handsets, subscriber growth is certainly driving demand for more capacity in the 5G Core.

In addition, many MNOs already offer 5G SA for enterprises and Fixed Wireless Access (FWA), but have not yet opened the 5G SA network to consumers; however, they are expected to do so soon. They include Bharti Airtel in India, 3 in Ireland, Sunrise in Switzerland, and AT&T and Verizon in the US.

Other MNOs have announced plans to launch 5G SA, but without specific timelines, including Bouygues Telecom, O2 Telefónica, and SFR in France, Bharti Airtel in India, MTN in Nigeria and South Africa, Rakuten in Japan, and Vodacom in South Africa, which will drive future growth. As a result, we project the 5G MCN revenue will grow at a 6% CAGR from 2024 to 2029.

Other factors impacting growth include:
  • NR Reduced Capability (RedCap): RedCap-enabled IoT will bring more 5G devices to market at a lower cost point with better performance, like new 5G smartwatches expected to be introduced in the fall. AT&T has announced nationwide RedCap coverage, maybe in anticipation of a new 5G smartwatch by Apple. Rumors of 5G smartwatches with RedCap coming this fall and winter are rampant for all smartwatch suppliers. These new smartwatches will require more capacity for the 5G Core. Even if these rumors do not materialize in this upgrade cycle, AT&T can offer more 5G SA services to enterprises using new IoT devices with RedCap.
  • 5G MEC: One example of Public MEC is Telefónica Spain, which is in the process of implementing 17 MEC nodes, delivering a latency of 10 ms to MEC subscribers by the end of 2025. Private MEC nodes are numerous (on-premises) with over 55,000 in China. The China market penetration rate is approximately 25% of enterprises, and Chinese MNOs are planning to address the next 25% of enterprises over the next several years. Also, Dynamic network slicing is maturing, and MNOs, such as Orange in Europe, are promoting these capabilities in their 5G SA markets.
  • Voice over NR (VoNR): As 5G SA continues to mature, MNOs are beginning to leverage more of the capability that 5G SA offers, for example: VoNR with cloud-native IMS Core is bringing immersive calling experiences to the user, driving Voice Core and 5G Packet Core growth. MNOs such as AT&T and Boost Mobile in the US, O2 Telefónica in Germany, and 2degrees in New Zealand are in the process of upgrading their Voice Core networks to IMS Core cloud-native network functions.
  • Impact of AI: Theoretically, Agentic AI apps can be connected to the network 24/7, which could significantly impact network performance, driving the demand for more packet core and voice core capacity. Examples of agentic AI are emerging as mobile network operators (MNOs) begin offering premium versions of advanced AI search tools to their customers. For instance, Bell in Canada and SoftBank in Japan have partnered with Perplexity to attract new customers to their networks. Additionally, a growing number of existing customers are utilizing AI independently.
  • Public Cloud: Another trend we are monitoring is the re-emergence of the option to put the 5G Core workloads in a Public Cloud. Public Cloud vendors are returning to the market with better solutions than several years ago, when we were in the hype phase about moving 5G workloads to the Public Cloud. MNOs can now evaluate which is the best approach for their market, build a 5G Telco Cloud, use the Public Cloud, or go with a Hybrid Cloud strategy.

Increasing 5G subscriber growth, additional 5G SA buildouts, more devices via RedCap, better performance via MEC with dynamic network slicing attracting new customers, greater use of Agentic AI, and more use of the Public Cloud are behind the driving growth for 5G SA networks.

[wp_tech_share]

Open RAN has made significant progress since the O-RAN Alliance was formed in 2018 to “reshape the RAN industry and ecosystem towards more intelligent, open, virtualized, and interoperable networks”. But the results have been mixed so far.

Cumulative Open RAN revenues are approaching $10 billion, the Open Fronthaul (OFH) interface has become an increasingly important requirement, and most leading operators now regard O-RAN, Cloud RAN, and AI-driven RAN as core pillars of their next-generation RAN roadmaps. However, multi-vendor RAN adoption and expectations remain limited. According to the latest 1H25 RAN report, market concentration—as measured by the Herfindahl-Hirschman Index (HHI)—is rising across several regions. The RAN market is now classified as “highly concentrated” (HHI > 2500) in five of the six tracked regions. This suggests that the supplier diversity element of the Open RAN vision is fading.

Market traction has also proven uneven. Open RAN initially scaled rapidly, fueled by large-scale deployments in Japan and the U.S. However, after this sharp rise, total Open RAN revenues declined by roughly 40% within two years, as activity outside early adopters failed to offset the slowdown in the U.S. and Japan. While some moderation was expected, the pace of deceleration was sharper than anticipated, in part because of weaker 5G investments overall.

Open RAN is beginning to show signs of stabilization. Preliminary data indicate that Open RAN revenues grew year-over-year (Y/Y) in 2Q25 and were nearly flat Y/Y in the first half, supported by easier comparisons, stronger capex tied to existing Open RAN deployments, and increased activity among early majority adopters.

Our long-term view has remained largely consistent since we began tracking the market in 2019. Long-term Open RAN growth prospects remain favorable. Although near-term headwinds and business case challenges persist, the broader trajectory continues to point toward greater openness, virtualization, intelligence, and automation across the RAN. We remain optimistic about the outlook for Open RAN and Cloud RAN in the latter part of the forecast period, though the attractiveness of the multi-vendor RAN model continues to be limited.

Additional highlights from the 2Q25 RAN report and August 2025 Open RAN 5-year forecast include:

  • The top 3 Virtualized RAN suppliers based on worldwide revenue (2Q25, 4-Quarter Trailing) are Samsung, Rakuten Symphony, and 1Finity (formerly Fujitsu).
  • Virtualized RAN revenue is expected to grow in 2025.
  • Multi-vendor RAN is projected to reach $2 billion to $3 billion by 2029.

For more information about our RAN and Open RAN coverage, please visit https://www.delloro.com/advanced-research-report/openran/