[wp_tech_share]

The rise of accelerated computing for applications such as AI and ML over the last several years has led to new innovations in the areas of compute, networking, and rack infrastructure. Accelerated computing generally refers to servers that are equipped with coprocessors such as GPUs and other custom accelerators. These accelerated servers are deployed as a system consisting of low-latency networking fabric, and enhanced thermal management to accommodate the higher power envelope.

Today, data centers account for approximately 2% of the global energy usage. While the latest accelerated server can consume up to 6kW of power each and may seem counterintuitive from a sustainability perspective, accelerated systems are actually more energy efficient compared to general-purpose servers when matched to the right mix of workloads. The advent of generative AI has significantly raised the threshold in compute and network demands, given that these language models consist of billions of parameters. Accelerators can help to train these large language models within a practical timeframe.

Deployment of these AI language models usually consists of two distinct stages: training and inference.

  • In AI training, data is fed into the model, so the model learns about the type of data to be analyzed. AI training is generally more infrastructure intensive, consisting of one to thousands of interconnected servers with multiple accelerators (such as GPUs and custom coprocessors) per server. We classify accelerators for training as “high-end” and examples include NVIDIA H100, Intel Gaudi2, AMD MI250, or custom processors such as the Google TPU.
  • In AI inference, the trained model is used to make predictions based on live data. AI inference servers may be equipped with discrete accelerators (such as GPUs, FPGAs, or custom processors) or embedded accelerators in the CPU. We classify accelerators for inference as “low-end” and examples include NVIDIA T4 or L40S. In some cases, AI inference servers are classified as general-purpose servers because of the lack of discrete accelerators.


Server Usage: Training vs. Inference?

A common question that has been asked is how much of the infrastructure, typically measured by the number of servers, is deployed for training as opposed to inference applications, and what is the adoption rate of each type of platform? This is a question that we have been investigating and debating, and the following factors complicate the analysis.

  • NVIDIA’s recent GPU offerings based on the A100 Ampere and H100 Hopper platforms are intended to support both training and inference. These platforms typically consist of a large array of multi-GPU servers that are interconnected and well-suited for training large language models. However, any excess capacity not used for training can be utilized towards inference workloads. While inference workloads typically do not require a large array of servers (although inference applications are increasing in size), inference applications can be deployed for multiple tenants through virtualization.
  • The latest CPUs from Intel and AMD have embedded accelerators on the CPU that are optimized for inference applications. Thus, a monolithic architecture without discrete accelerators is ideal as capacity can be shared by both traditional and inference workloads.
  • The chip vendors also sell GPUs and other accelerators not as systems but as PCI Express add-in cards. One or several of these accelerator add-in cards can be installed by the end-user after the sale of the system.

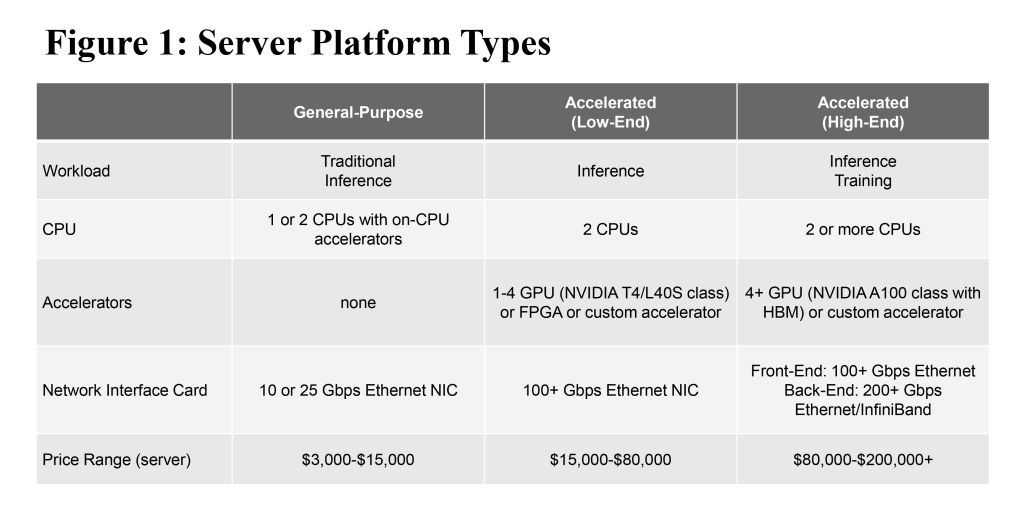
Given that different workloads (training, inference, and traditional) can be shared on one type of system, and that end-users can reconfigure the systems with discrete accelerators, it becomes less meaningful to delineate the market purely by workload type. Instead, we segment the market by three distinct types of server platform types as defined in Figure 1.

Server Platform Types - DellOro

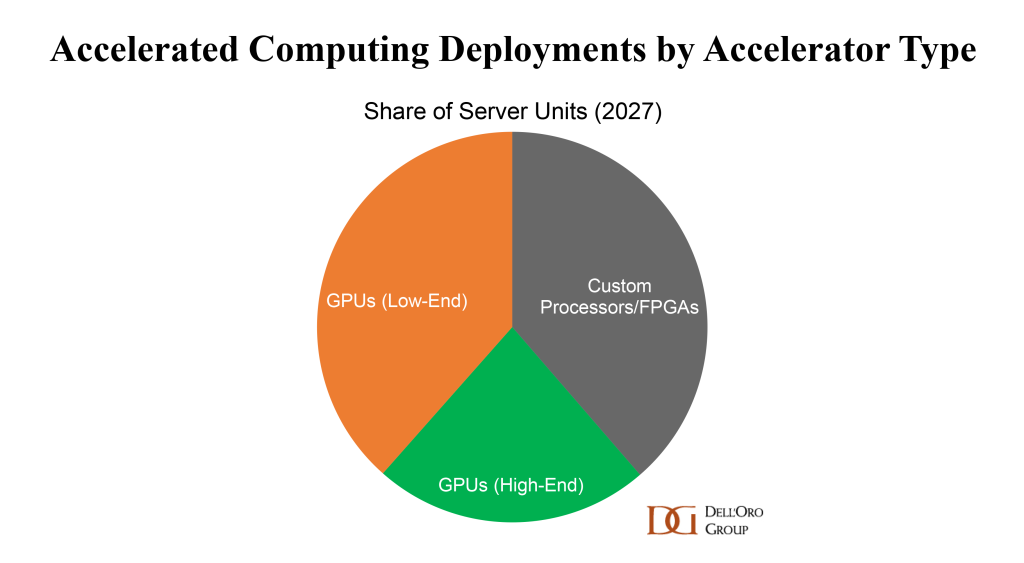
We expect each of these platform types to have a different growth expectation. Growth of general-purpose servers is slowing, with a 5-year CAGR of less than 5% given increasing CPU core counts and use of virtualization. On the other hand, accelerated systems are forecast for a 5-year CAGR in the range of approximately 40%. By 2027, we project accelerated systems will account for approximately a 16% share of all server shipments, and will have the mix of accelerator types as shown in Figure 2.

Looking ahead we expect continued innovation and new architectures to support the growth of AI. More specialized systems and processors will be developed that will enable more efficient and sustainable computing. We also expect the vendor landscape to be more diversified, with compelling solutions from the vendors and cloud service providers to optimize the performance of each workload.

To get additional insights and outlook for servers and components such as accelerators and CPUs for the data center market, please check out our Data Center Capex report and Data Center IT Semiconductor and Components report.
[wp_tech_share]

Enterprise Class WLAN sales increased by 47% Y/Y in the first half of 2023.  With this meteoric acceleration in manufacturer revenues as a backdrop, industry luminaries gathered in Toronto this week at the Wi-Fi World Congress North America Wi-Fi NOWs CEO, Claus Hetting, hosted and facilitated the conference, peppering the speakers with questions that highlighted the innovation and thought leadership in the room.  Chetan Hebbalae, formerly at Meta on TIP’s OpenWiFi project, and now VP of Products at Kyrio, summarized the essence of the event by quoting science fiction writer Arthur C Clarke: “Any sufficiently advanced technology is indistinguishable from magic.”

Advanced technology was on full display as Akoustis showed off the company’s ultra-wide bandwidth RF filters, used in HPE’s 655 access point (AP). Dave Aichele, VP of Business Development, explained that Akoustis’s mastery of material science allowed the Wi-Fi 6E AP to make full use of the new 6 GHz band, one of the few APs on the market to do so.  Qorvo referenced the increased power consumption of triband APs, pointing to the power conservation of their Front End Module (FEM), and the increased competition in the FEM market keeping them on their toes.

At their booth, VVDN Technologies displayed a Wi-Fi 7 AP produced from their cutting-edge reference design. The enterprise market is seeing early product announcements in the new 802.11be (Wi-Fi 7) protocol, with H3C already selling a flagship product in China and EnGenius promising an AP in November.

Malcolm Smith of Cisco’s CTO Advisor group described how TSN (Time Sensitive Networking) with scheduling in Wi-Fi 6 and 7 could lead to bounded latency for applications such as VR.  Hyper directional antennas were evangelized by Bill Anderson, AmpThink’s founder, as a game changer in stadium deployments, allowing installations at a quarter of the cost of under-seat APs.  Bart Giordano, President of Ruckus at CommScope focused on the technology that has been front of mind for IT leaders since the advent of Chat GPT; explaining that the drastic reduction in the cost to train AI models will revolutionize not just enterprise WLAN, but all jobs in all domains.

The advanced science turned to the magic that Arthur C. Clarke predicted, as speakers and panelists shifted to discuss use cases and end-user experience. Elizabeth Parks, President of Parks Associates, kicked off the second day of the conference by promising that the 4th industrial revolution would be all about services and pointing to the enormous Wi-Fi opportunity in the MDU market.  Only between 1 and 2% of MDU homes have access to a managed Wi-Fi service.  Robert Grosz, President of WorldVue, urged conference attendees to focus on the needs of MDU property owners by emphasizing Wi-Fi as a capital asset with revenue potential, instead of just an expense.

There were plenty of other Wi-Fi use cases discussed, both practical and entertaining.

Bahador Amiri, Senior Director of Wireless Engineering at Cisco, explained that a combination of different location technologies: GPS, Wi-Fi FTM (Fine Timing Measurement or 802.11mc), and 802.11az, among others, enables asset tracking, indoor navigation, and smart workspaces.  He then took the audience on a cruise ship journey, with room doors that unlocked automatically, guests that were prevented from enjoying the amenities until they had watched the safety video, and a drinks service that delivered your order wherever you were on the ship – with all of these use cases relying on Wi-Fi location services.

Keeping the focus on user experience, Michael Penney, SVP of Engineering at American Bandwidth, promised to turn Wi-Fi APs into mini cell towers, using Passpoint and OpenRoaming to transparently move end users between cell and Wi-Fi service – solving the problems related to poor cell coverage indoors.

Amidst the speakers’ presentations and panels, some contentious questions were addressed, answered, or debated during the conference.

Will Campus Network As A Service expand Wi-Fi’s addressable market?  There was a divergence of opinion on whether Campus NaaS was an innovative architecture or a new business model.  Bob Friday, CTO and Co-Founder of Juniper’s Mist, pointed to the foundational role that AI operations played in automating Wi-Fi management.  Nile’s impressive demo underlined the service’s potential.  Dell’Oro Group has quantified the size of this market and its accretive potential in an Advanced Research Report entitled Campus NaaS and Public Cloud Managed LAN.

Will private 5G take market share from Wi-Fi?  AmpThink’s Bill Anderson presented a fascinating analysis of two stadium deployments, one with Wi-Fi and one with cellular technology.  The Wi-Fi installation was 105 times less expensive than the private cellular deployment, dropping the price per Tb from $3.9 M to $0.192 M.  With its Zero Effort Networking (ZEN), American Bandwidth’s Michael Penney decried the onus of having to prove to a carrier that indoor coverage is bad, with a call to focus on user experience instead.  Says Penney: indoors, Wi-Fi is the clear winner.

Is there an advantage to disaggregating Wi-Fi? OpenWiFi was front and center in a panel discussion with representatives from several companies, along with the Telecom Infra Project (TIP), demonstrating the breadth of the ecosystem.  Tony Stramandinoli, VP of sales at Edgecore, explained that his company’s focus on AP hardware, and using OpenWiFi software, has enabled faster innovation.  Robert Grosz of WorldVue, who deploys networks with Ruckus, Aruba, Meraki, and Cambium, has also deployed OpenWiFi solutions. He explained that after a family moves out of an apartment in an MDU, the cleaning crew can rip out or paint over the AP accidentally.  For this use case, disaggregating the hardware from the software is most beneficial!  Opening up the interface between the controller and the AP enables redundancy of hardware suppliers. C3Spectra and NetExperience are two companies that offer OpenWiFi compliant controllers. An SDK interface encourages innovation at the application level, highlighted by GoZone and Spectra who develop compatible application suites.  Bernard Herscovici, CEO of NetExperience, referenced Purchase Orders for 5 Million Open Wi-Fi APs.

The buzz of the Wi-Fi Now Toronto event was palpable.  During an evening of fancy cocktails, attendees lined up to get a signed copy of Greg Ennis’s book, Beyond Everywhere: How Wi-Fi Became the World’s Most Beloved Technology.   Bart Giordano highlighted the depth of experience in attendance as he quipped that despite being around since 802.11g, he didn’t even merit a footnote in Greg’s book.  With a Wi-Fi ecosystem this deep and broad, it’s no wonder it can spin science into magic.

[wp_tech_share]

A Problem to Solve

For the past couple of decades, the rising demand for optical network capacity has been counter-balanced by the declining price of a Gbps. It was one reason service providers could keep up with customer demand for bandwidth without exponentially growing their Capex spend. However, while bandwidth demand rose, the cost to lower the price-per-Gbps increased. Stated another way, optical companies had to perpetually invest more resources in research and development (R&D) to solve one key problem for their service provider customers: keeping the cost of bandwidth from growing exponentially.

Demand for Bandwidth Grows 30% Annually

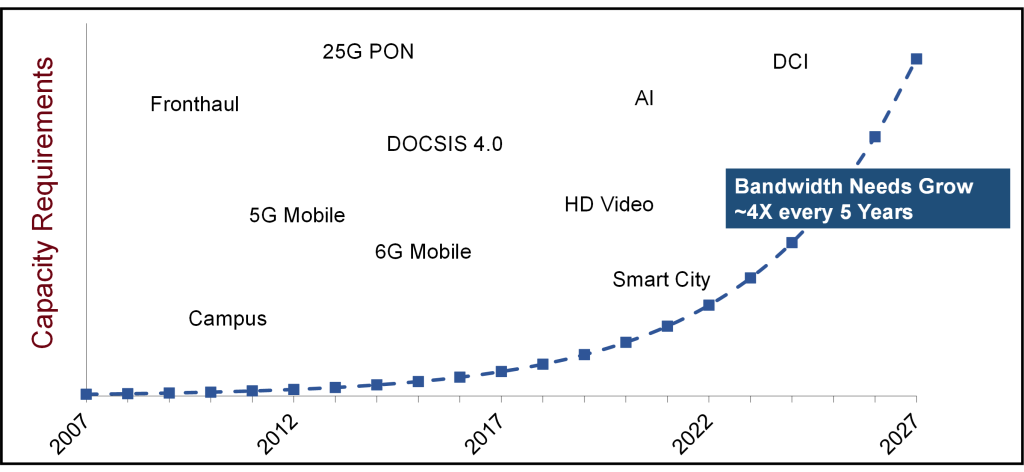
The demand for capacity in long distance networks has been growing at an average annual rate of 30% for the past decade and is expected to do the same for the next decade. This means that for every five-year period, the amount of installed network capacity on a Gbps basis needs to grow by roughly 4X. This increase in bandwidth is driven by an increase in applications that consume more capacity.

  • Access technology: The technology in the access layer increased the speed that end users were able to access the internet from Kbps to Gbps. The latest access technologies include 25G PON and 5G; the future includes 50G PON and 6G.
  • Densification: More places are being connected with fiber. Over time, fiber connections have moved from central offices to city blocks and now to homes. Smart cities are emerging that integrate communication technology with the infrastructure, further pushing up the number of connected devices, including those for safety and security.
  • Video: High definition (HD) video has moved beyond the television to handheld devices, surveillance cameras, and even doorbells.
  • Artificial Intelligence (AI): This is just the start of AI and machine learning (ML). We think ChatGPT was the first of many new applications leveraging AI and ML that will appear in the market. In fact, it is a possibility that AI/ML applications will drive annual bandwidth growth beyond 30% in the future.

Price of a Gbps Declined 20% Annually

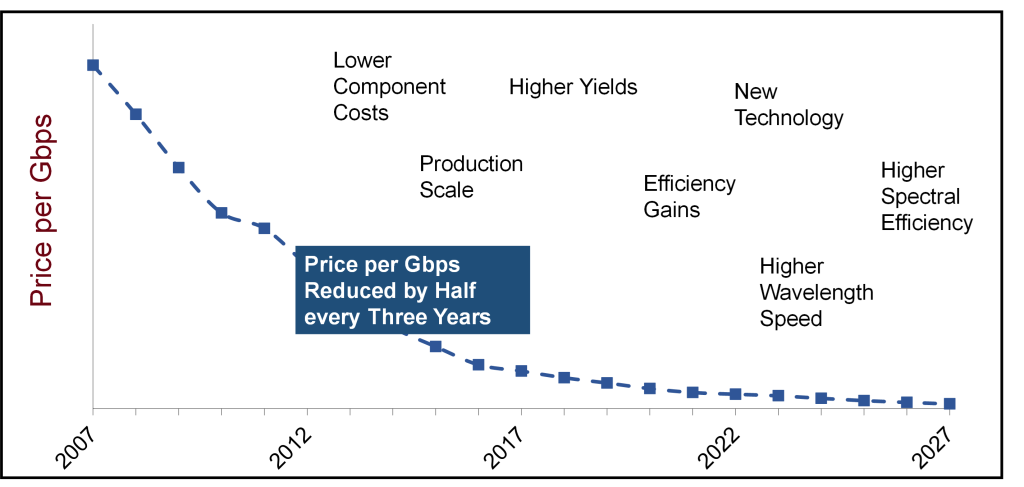
Although bandwidth requirements grew exponentially, service provider Capex grew linearly. This is because the price of DWDM equipment on a Gbps basis declined at 20% annually or by half every three years.

Price of a Gbps Declined 20% Annually

The 20% annual price decline is broadly achieved through the combination of two cost drivers:

  • Efficiency gains: We believe efficiency gains contribute approximately one-third of the annual price reduction. A few ways to improve efficiencies include improving manufacturing processes, achieving better product yield, and obtaining manufacturing scale.
  • Innovation: New technologies introduced into the market contribute the remainder of the 20% price reduction. These new technical innovations include coherent DSP and photonics to produce higher wavelength speeds that have better spectral efficiency (SE).

Spectral Efficiency Improvements Slowing

One of the main methods to lower the price-per-Gbps is to increase the SE of a wavelength. When sending more bits in the same amount of spectrum, the service provider amortizes the high cost of the optical line system (comprised of DWDM chassis, amps, ROADMs, and fiber) over more bandwidth. Thereby, lowering the price-per-bit of the network.

Coherent Technology

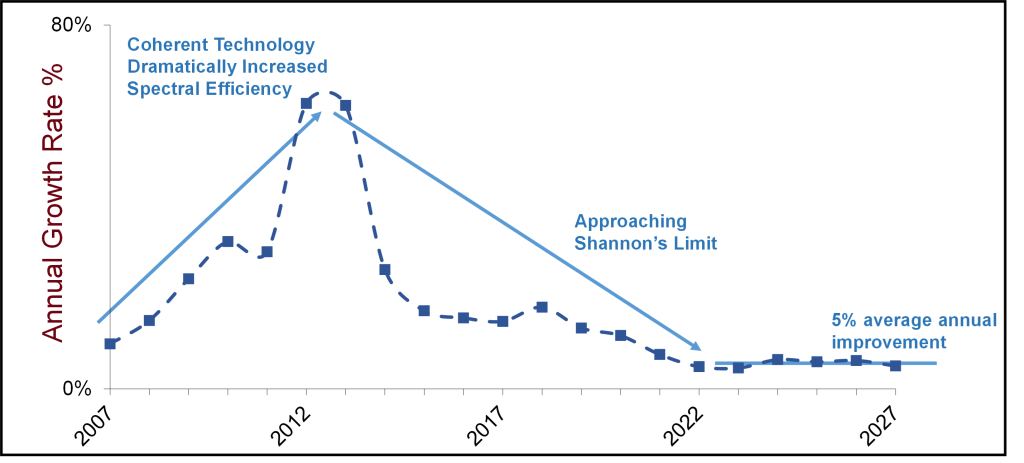
But, as we approach Shannon’s Limit, SE improvements are slowing and a problem is emerging.

  • Beginning in 2008, SE improvements accelerated higher due to the introduction of coherent technology. When a service provider moved from using a 10 Gbps wavelength to a coherent 100 Gbps wavelength, the SE increased 10X.
  • Although SE improved with the availability of new wavelength speeds, it was not at the same scale because the SE improvement of each generation is less than that of the previous generation as we advance towards Shannon’s Limit.
  • We believe the SE improvements in the next five years will only be 5%.

The Problem Statement

Increasing SE was the biggest lever to reducing the price-per-Gbps. However, due to Shannon’s Limit, future SE gains are harder to realize. Therefore, new technical innovations must be created. Otherwise, one day, service provider Capex will need to grow exponentially to keep up with user demand for bandwidth.

[wp_tech_share]

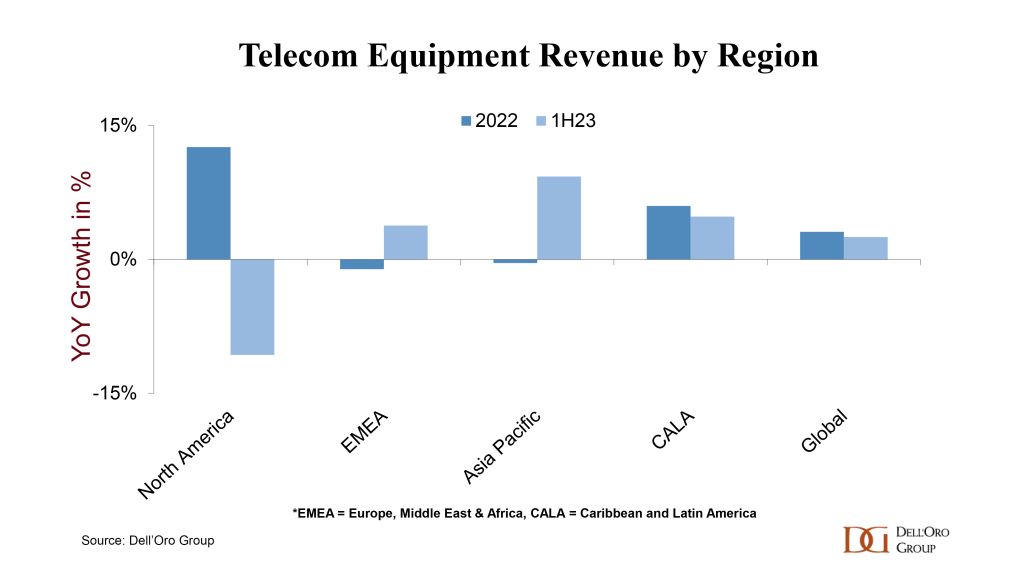
Telecom holds steady in the first half. According to preliminary findings, worldwide telecom equipment revenues across the six telecom programs tracked at the Dell’Oro Group*, were flat year-over-year (Y/Y) in the quarter and advanced 2% in the first half of 2023.

These results mostly align with expectations on an aggregate level, although performance by region and technology varied. After five years of expansion, during which the North America region advanced by around 50%, the pendulum swung toward the negative in the first half. The decline in North America was anticipated, but the pace of the contraction was slightly faster than expected. Alongside more challenging 5G comparisons and inventory corrections affecting some technology segments, North American Broadband Access equipment spending dropped to its lowest levels in nearly two years in the second quarter.

Stable performance in EMEA, CALA, and China, combined with robust growth in the Asia Pacific region outside of China, offset the weakness in the US market. Worldwide telecom equipment revenues, excluding North America, increased by 7% in the first half, supporting the thesis that the telecom equipment market remains robust outside of the US.

From a technology perspective, RAN declined, but the remaining five programs advanced in the first half. Notably, wireline outperformed wireless. Our analysis indicates that the collective results for the wireline-focused programs (SP Routers & Switches, Optical Transport, and Broadband Access) increased by around 7% in the first six months. This, coupled with the positive trends in Mobile Core Networks and Microwave Transmission, was more than enough to offset the more challenging conditions in RAN.

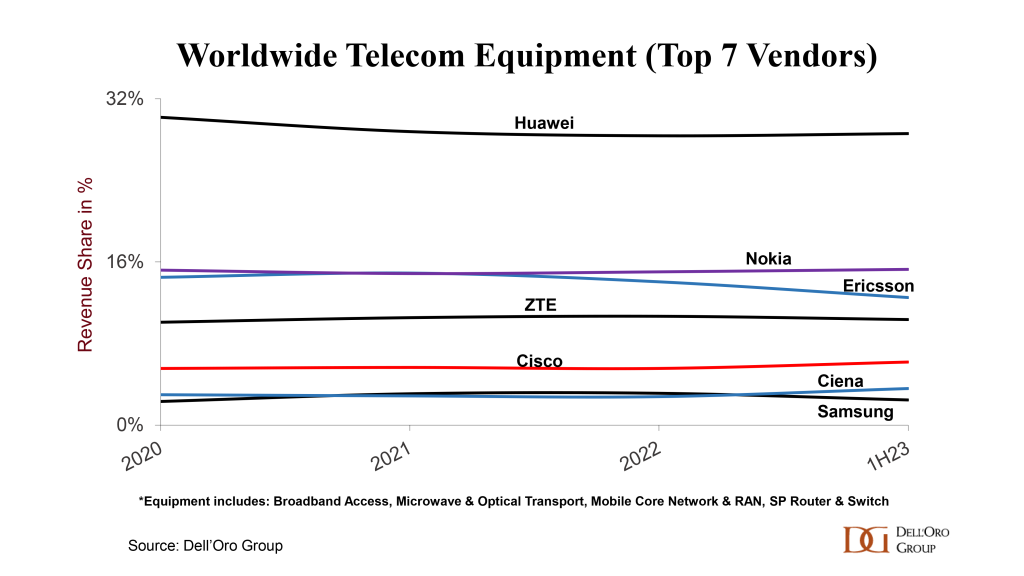
Vendor dynamics remained mostly stable between 2022 and 1H23, with a few exceptions. Ciena surpassed Samsung, and the gap between Nokia and Ericsson widened, reflecting, to some extent, the technology mix between wireless and wireline. Despite ongoing efforts by the US government to limit Huawei’s addressable market and access to the latest silicon, our analysis shows that Huawei still leads the global telecom equipment market. This is partly because Huawei remains the #1 supplier in five out of the six telecom segments we track, and the vendor continues to dominate the market outside of North America, accounting for 35% to 40% of 1H23 revenues.

The analyst team has not made any significant changes to the collective short-term outlook. Following five consecutive years of growth, worldwide telecom equipment revenues are projected to remain flat in 2023. As always, there are risks in both directions. In addition to currency fluctuations, economic uncertainty, and elevated interest rates, inventory adjustments, new technology rollouts, and the anticipated impact of national subsidization efforts can impact steady-state assumptions for the various regions.

*Telecommunications Infrastructure programs covered at Dell’Oro Group, include Broadband Access, Microwave & Optical Transport, Mobile Core Network (MCN), Radio Access Network (RAN), and SP Router & Switch.

[wp_tech_share]

Chinese operators are moving quickly to the next phase of residential fiber deployments by extending fiber inside homes and into individual rooms through a unique combination of a centralized ONT (Optical Network Terminal) and subtended ONT access points designed to ensure advertised speeds with the option of wired and Wi-Fi connections in each room of a home. The net result of this surge in FTTR deployments has been a steady increase in FTTR-optimized ONT shipments.

Through the first half of 2023, more than 6M FTTR ONT units have been purchased by the three major operators. To provide some perspective, this total is less than 20% of the total ONT shipments in China in that same time frame. However, that growth has come in just a little over a year and a half, which signals the strategic importance of the application to the operators. Further, that growth comes from just a handful of major regional branches of China Mobile and China Unicom. China Telecom is just now getting underway with FTTR, having set forth its plan to purchase 500K FTTR ONTs earlier this year.

The three operators are expected to rapidly expand the availability of FTTR services and packages throughout the rest of this year and into 2024, as the application is viewed as a critical driver of four overarching business goals for their fixed broadband business units:

  • Increasing ARPU (Average Revenue Per User)
  • Reducing subscriber churn
  • Reducing energy consumption in the home and throughout the network
  • Reducing service and support costs by improving the quality of service


From Gigabit Cities to Gigabit Homes

Back in 2013, the Chinese Government set an ambitious goal of delivering gigabit speeds to 400M households in China’s largest cities by 2020. The project reach approximately 200M homes before the COVID-19 pandemic delayed further expansion. In 2021, the Government re-issued its objectives and set a goal of achieving the 400M home goal by the end of 2023. At this point, it is believed the total number of gigabit homes is nearing that 400M mark, as over 100 cities have now been designated as Gigabit Cities.

Historically, though, operators delivered fiber to the floor of a building and then connected each apartment via DSL or Ethernet or dropped fiber to a single ONT or ONT gateway inside the home. To expand Wi-Fi coverage in the home, subscribers could either purchase their own access points or could use those supplied by the operator. Nevertheless, in very densely-populated cities, subscribers often ran into channel contention issues, reducing the throughput of their Wi-Fi connections and reducing the overall quality of service, particularly during peak hours.

These challenges became more acute during the pandemic when cities and buildings were locked down and service provider technicians could not access residences to diagnose and troubleshoot Wi-Fi and other connectivity issues. So, even in China’s showcase Gigabit Cities, subscribers were getting far slower speeds than what was being touted by their service providers.

To solve these issues, the three major operators realized that the only way they could guarantee consistent throughput throughout the home was to extend fiber to each room. The most economical way to do this was to use the same architecture as their PON access networks, but just on a smaller scale, using a passive splitter in front of the primary ONT gateway. From there, the operators worked with domestic equipment manufacturers and cabling and component suppliers to develop solutions that would allow technicians to easily install flat fiber or fiber electric composite cables to each room, depending on whether the ONT access point required an external power supply.

Flat fiber installation tools were developed that allowed a technician to run fiber along baseboards, doors, and window frames, minimizing the obtrusiveness as much as possible. Additionally, software tools were developed to allow the technician to quickly determine the shortest route and quickest installation approach before commencing the work. The net result is that the average installation time is reported to be around 30 minutes or less.

Even before the technician arrives, the upfront work of determining demarcation between building owners and the service provider is completed, so that the FTTR service can be marketed throughout the building and installations can be scheduled and completed as quickly as possible.


Up-Front Costs, Long-Term Benefits

In a competitive environment like China, where broadband ARPU tends to be low and fairly static, FTTR has turned out to be a source of new revenue for the operators, as well as a way to get subscribers to commit to longer-term contracts. Subscribers can choose to pay 2000 RMB (US$277) up-front to cover the costs of the installation, as well as the additional ONTs, or they can commit to a multi-year contract, paying 30-40 RMB (US$4-$5) per month for a minimum of 2-3 years. Historically, broadband service contracts were limited to one year. Because of the additional labor and equipment costs associated with FTTR, operators were allowed to extend the contracts. With the additional costs of the ONTs bundled in, the operators have anecdotally said that the ARPU uplift for FTTR is around 30%. With mobile ARPUs getting squeezed, FTTR is seen as a way to recoup some of those lost margins while also ensuring improved QoS.

Speaking of QoS, the operators have reported that the combination of FTTR plus Wi-Fi 6 improves overall speeds by up to 80% over previous-generation Wi-Fi 5 access points. Much of the gain is in the improved rates and reach of Wi-Fi 6. But using fiber as a backhaul technology from the local access point to the primary ONT gateway also helps to improve speeds and reduce latency by up to 30%. More importantly, operators know that each home will have full Wi-Fi coverage, rather than assuming the subscriber has correctly placed the access points to eliminate dead zones. That helps to reduce support and troubleshooting calls.

Finally, from an environmental perspective, the use of passive splitters and components in the home offsets the increased number of powered ONT access points. But these units are also more power-efficient than previous generations of access points. When combined with the reduced power needs of PON access networks, in general, the FTTR architecture is a net reduction in carbon footprint.


Global Opportunities

Nearly all FTTR deployments have occurred in China, though there are already signs of international expansion in Hong Kong, UAE, and Brazil. Certainly, countries with high fiber penetration combined with a high percentage of MDU-based residences are the low-hanging fruit for FTTR. This is why we expect to see increased FTTR activity in markets such as Hong Kong, Singapore, the UAE, and Korea over the next two years.

In addition to high fiber penetration, regulations clearly defining the demarcation between building owners and service providers must be in place, as well as updates to building codes that clarify approved installation methods for flat fiber and best practices for fiber maintenance. In countries with low fiber penetration, these standards have yet been developed due to the need has not been there. Or in countries with FTTH deployments, standards, and demarcations have been defined for a single drop point to the customer’s residence—simply updating architectures that have been in place for decades with twisted pair and coaxial cable.

Time will tell whether an increase in fiber ISPs’ results in those ISPs differentiating their service with an FTTR offering. ISPS may offer FTTR as a premium service. At this point, however, all eyes are fixed on Wi-Fi 7 gateways and access points as the cure-all for spotty coverage and capacity issues.