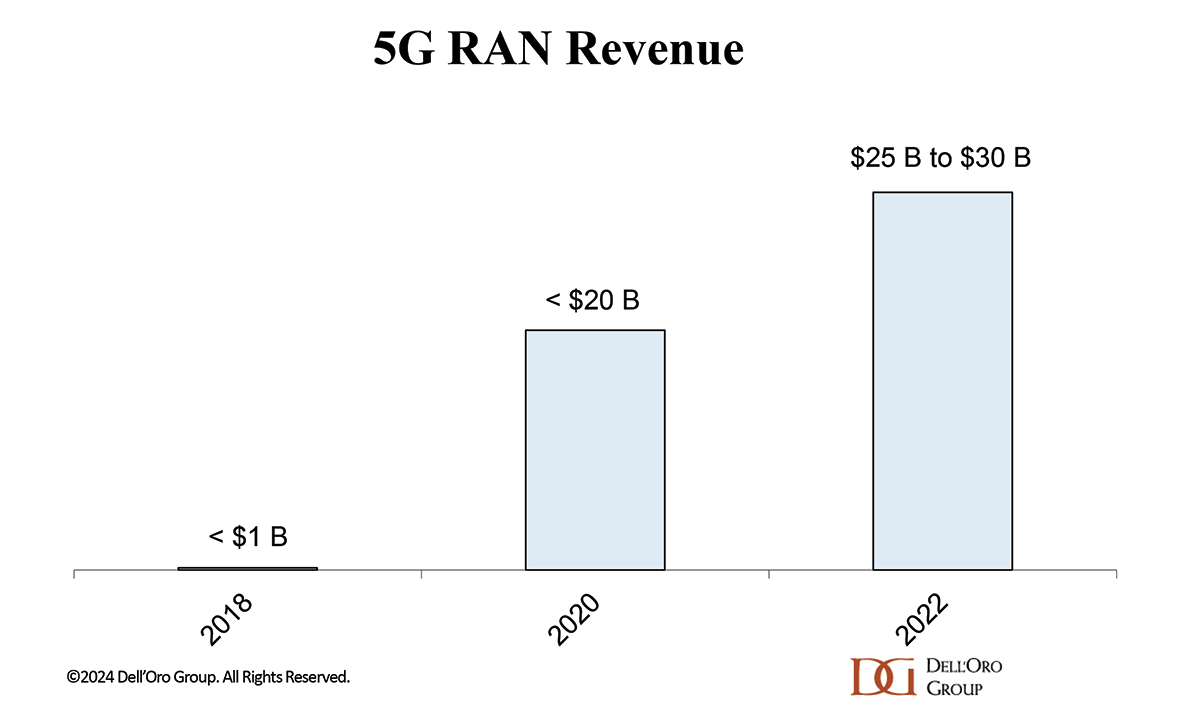
5G RAN revenues accelerated rapidly between 2018 and 2022, propelling 5G RAN to account for around two-thirds of total 3G-5G RAN before stabilizing in 2023. With the pace of 5G construction now slowing, partly due to more challenging comparisons in advanced MBB markets, it’s important to note that growth prospects for FDD and TDD are not the same. TDD dominated investments in the first phase as operators focused on capitalizing on the larger channel bandwidths available in the upper mid-band. The mix between Sub-6 GHz FDD and TDD is expected to evolve going forward as FDD growth outpaces TDD.
While the upper mid-band offers large bandwidths of unoccupied contiguous spectrum, the combined FDD assets in the sub-3 GHz bands are significant. The amount of spectrum varies depending on the market. However, FDD generally provides around 100 MHz of combined uplink and downlink bandwidth when adding up the paired 600, 700, 800, 900, 1.4, 1.8, 2.1, and 2.6 GHz bands. Even if the spectral efficiency upside between 4G and 5G is limited, especially in non-massive MIMO configurations, FDD still comprises approximately a third to a half of the overall sub-6 GHz spectrum. In other words, sub-3 GHz deployments will play a growing role in the broader 5G roadmap as most 4G FDD spectrum will eventually become 5G.
Operators initially tend to focus on the upper mid-band before complementing it with narrow-band FDD deployments. However, results from 5G NR FDD-only deployments suggest that this spectrum holds significant potential. For example, in the Netherlands, the delay in C-band spectrum provisioning prompted local operators to optimize the use of existing assets, coordinating 4G and 5G technologies across high and low FDD bands to create a high-performance network. Umlaut testing has shown impressive average data rates and latency results in the Netherlands even with the C-Band delays.
In addition to the combined spectral resources in the sub-3 GHz bands, another major benefit is the improved RF propagation characteristics. The inversely proportional relationship between wavelengths and carrier frequencies means that the lower sub-3 GHz frequencies enhance coverage in rural areas, improve in-building performance, and elevate the uplink experience.
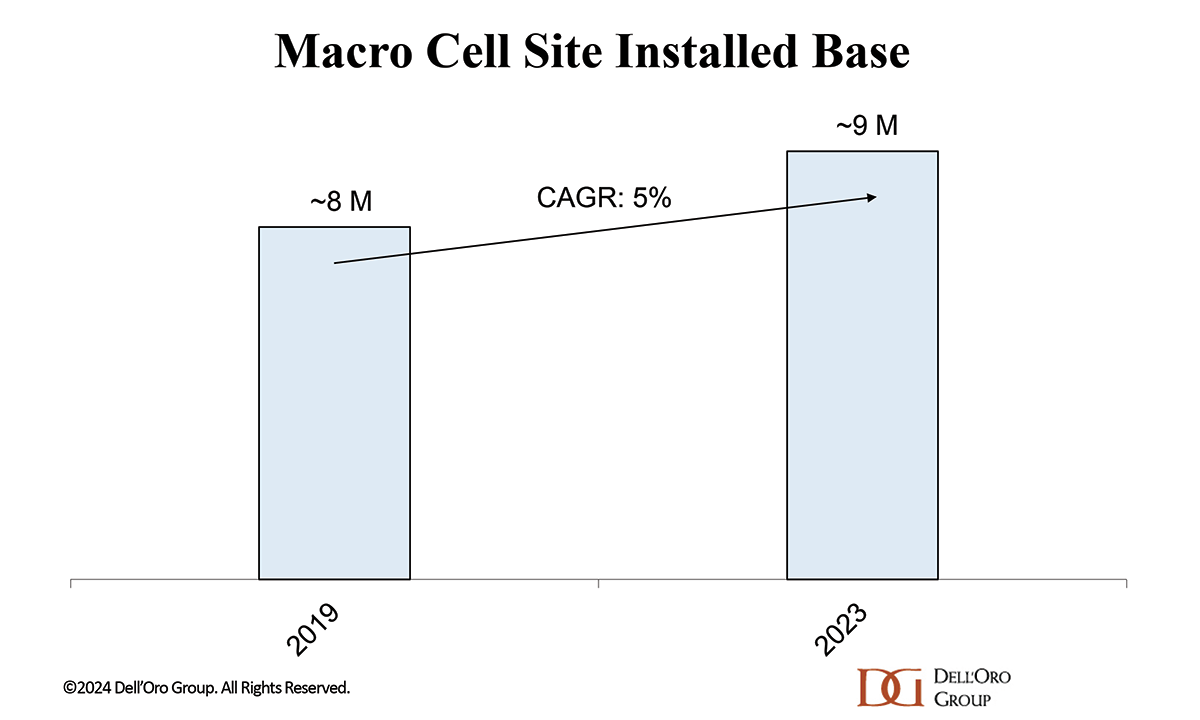
The situation is complicated by the small bandwidths scattered across multiple discrete bands, increasingly crowded and complex sites, challenging antenna form factors, and slowing physical cell site growth. At the same time, innovation is on the rise to tackle some of these challenges.
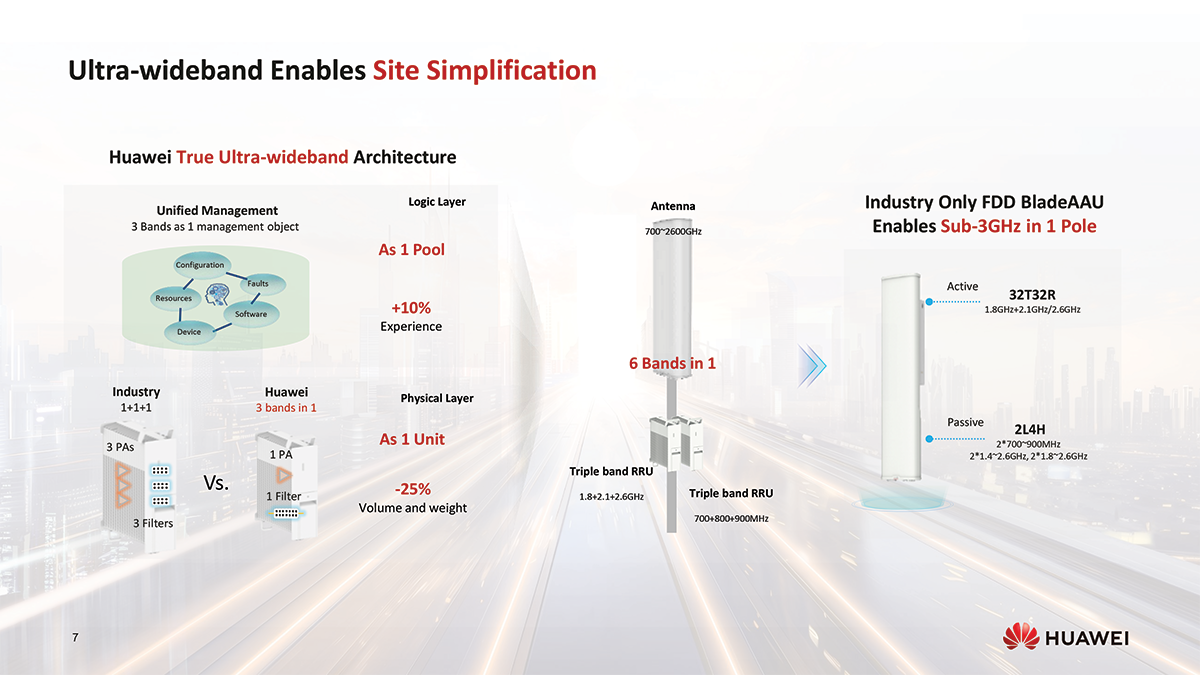
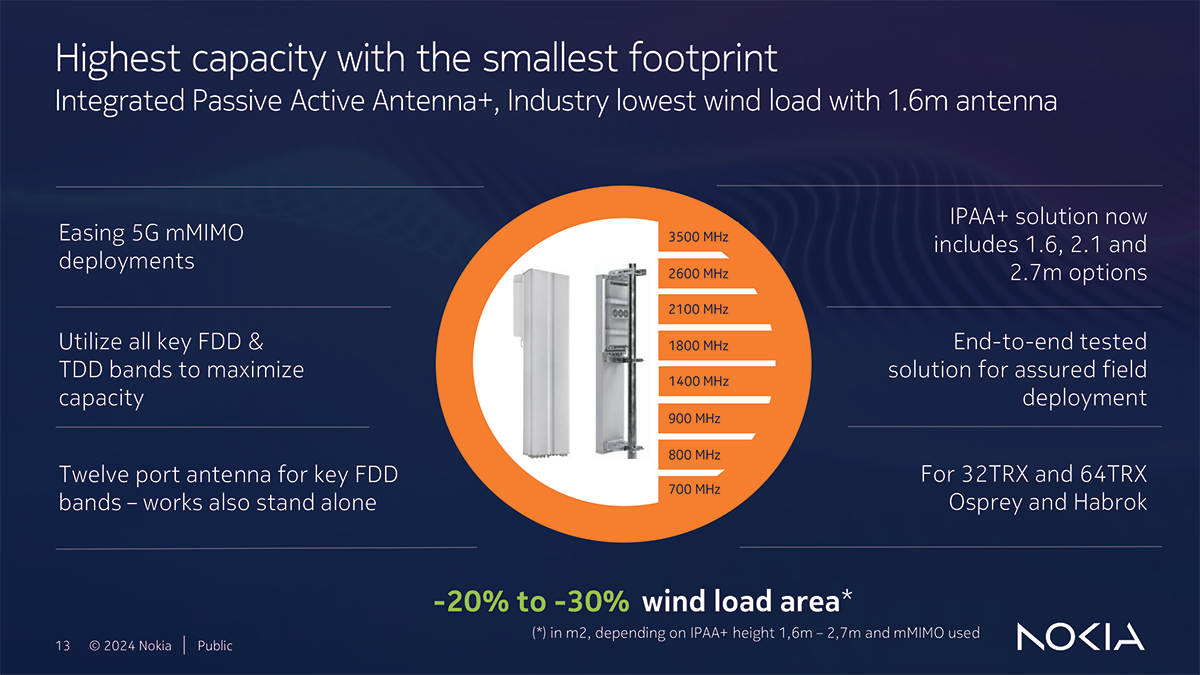
Site simplification is a top priority. Wideband technology enables multi-band deployments within a single radio, supporting both spectrum and power resource pooling. Most leading suppliers now offer multiband/wideband radios and antennas, which facilitate more compact site designs, simplify installation, and accelerate time to market. Some of the latest multiband radios can support three bands in a single device, and in some cases, they use just one PA (power amplifier) and filter, which helps reduce the radio’s form factor, weight, and power consumption.
Massive MIMO is not expected to play the same role with FDD as it did with TDD, in part because the 8T8R business case is more compelling in these bands. Even so, continued antenna innovation, combined with advancements in beamforming technology, will help boost the reach of higher-order and Massive MIMO in the FDD bands.
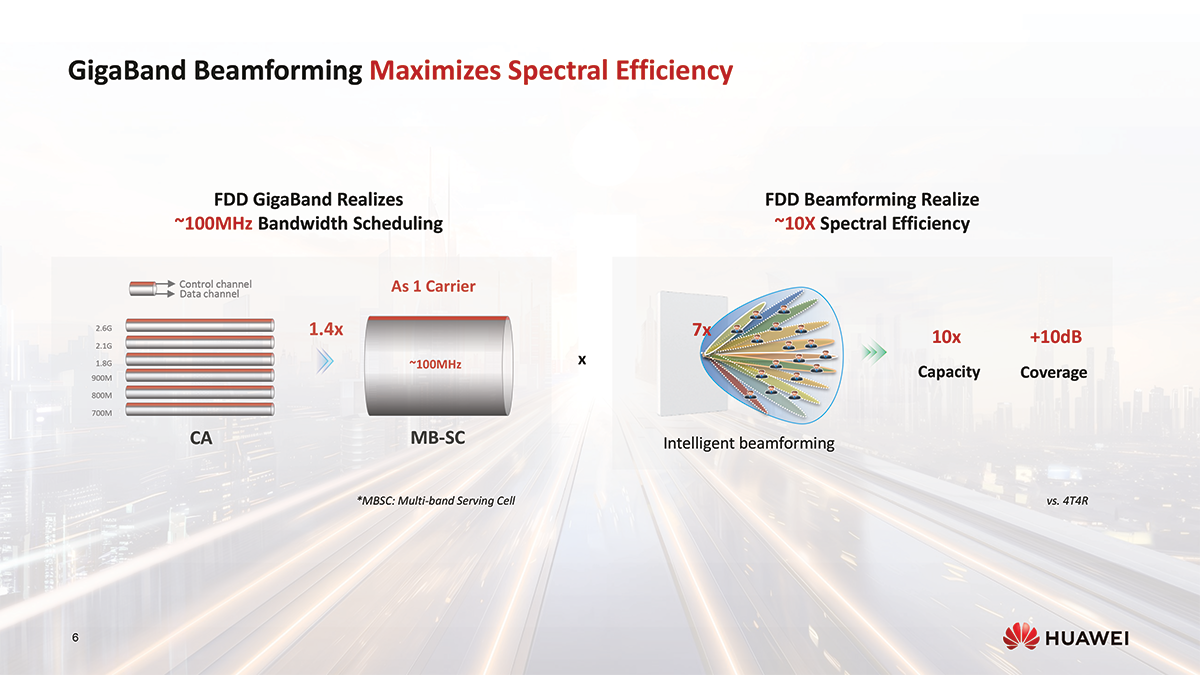
According to Huawei, intelligent beamforming combined with multi-band serving cell (MBSC) can potentially raise the overall FDD capacity and throughput by about 10x, relative to 4T4R.
5G Carrier Aggregation (CA) investments have been minimal to date but are projected to play a greater role in the future as operators expand the use of the sub-3 GHz spectrum. In addition to the potential for multi-Gbit data rates, operators can extend the mid-band range by aggregating low-band FDD carriers. For example, Elisa overcame uplink limitations in the upper mid-band by aggregating its C-band holdings with the 700 MHz carrier, which also enabled Elisa to double 5G throughputs at the cell edge (Nokia/Elisa case study).
Ericsson and T-Mobile recently demonstrated 3.6 Gbps speeds using 245 MHz of aggregated FDD and TDD spectrum. Additionally, Dish and Samsung showcased peak speeds of 1.3 Gbps using 75 MHz of FDD spectrum across three FDD bands.
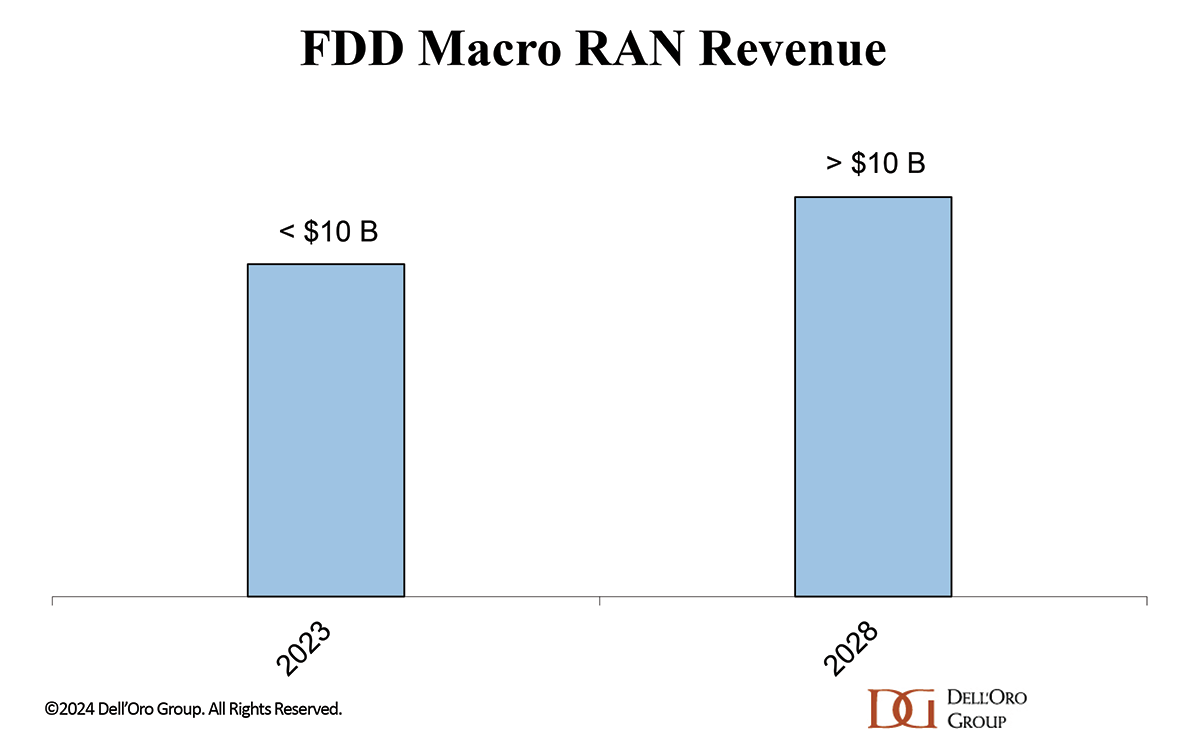
In our latest 5G RAN forecast, we model FDD-based macro-RAN revenues to accelerate faster than the more mature TDD-based 5G RAN market, partly due to advancements in the 3GPP Release 17/18 specification paving the way for continuous high-bandwidth FDD deployments and multi-band FDD+TDD CA. The forecast rests on the assumption that the 8T8R gains relative to 2T2R/4T4R are sufficient to justify substantial 8T8R deployments (>20%). The future of FDD Massive MIMO looks positive, though the business case will be more limited compared to upper mid-band TDD Massive MIMO.