Optical Transport DWDM Market is Very Competitive
“Very competitive” is the best way to characterize the Optical Transport DWDM equipment market. While it is a sizeable market, weighing in at $15 billion, there are about 20 systems manufacturers that actively participate in selling DWDM equipment and aggressively vie for market share. That said, 90 percent of the market is held by only seven vendors, leaving 10 percent for the remaining vendors, and even among the top seven, the market share delta is large—25 percentage points between the largest and smallest vendor.
Company scale and investment is a key differentiator that seemingly divides the market, where among the top vendors, outside of FiberHome, all have invested in vertical integration on line-side components such as coherent DSP and optical front end. It doesn’t seem to matter whether the optical front end is based on Silicon Photonics (SiPh) or Indium Phosphide (InP) even though industry pundits continue to debate the two technologies. The deciding factor is that the company has developed an in-house technology that differentiates the products from others, lowers its product costs, and gives the company a better time to market. Furthermore, since it takes considerable scale and resources (money, people, and intellectual property) to develop these components, vertical integration creates a barrier to new (and even old) entrants.
![]()
Product Substitution is Available
Like most industries, an external force to the Optical Transport industry is product substitution. While product substitution was not a real threat in the decades past, due to the inherent benefits in performance and cost of DWDM technology along with the system-level constraints on incorporating DWDM technology in an adjacent platform, the tide is starting to turn a little with small form factor 400ZR pluggable optics. As a result of these new pluggable optics in a QSFP-DD form factor that can transmit 400 Gbps wavelengths up to 120 kilometers, we are anticipating a growing interest in IP-over-DWDM (IPoDWDM), which is a system architecture that incorporates DWDM optics in an Ethernet Switch or Router. This will, without saying, increase the level of competition in the DWDM equipment space as customers decide between using a traditional DWDM system from our 20 DWDM vendors or an IPoDWDM system from other switching vendors. (The top Ethernet Switch and Router vendors include Arista, Cisco, Juniper, and Nokia).
However, 400ZR will also benefit the optical DWDM vendors. One reason is that not all operators will want to change their network to IPoDWDM and will choose to use 400ZR pluggable optics on a DWDM system, keeping the network architecture somewhat unchanged while benefiting from the lower cost of 400ZR optics. But another reason is that 400ZR is a coherent technology and therefore the companies that have invested in this technology over the past decade are well positioned to address this new opportunity. Hence, the manufacturers of 400ZR pluggable optics are mostly comprised of companies that have a long history in the development of coherent DWDM systems, such as Ciena, Cisco, and Nokia. Huawei intended to develop a 400ZR as well, but we are unsure as to whether the US restrictions on the company will delay this endeavor.
Customers Prefer Local Suppliers When Available
In some ways this is neither old nor new, but it is important to reiterate that generally customers prefer to purchase equipment from a local supplier. In this chart, the global DWDM equipment market is sliced into major regions and the vendors that supply in a given region. The size of the box portrays the vendor share in that region, and the green shaded boxes are the vendors that are considered domestic to that region. It is not a surprise that in the two regions—North America and China—where there are a large number of domestic vendors, the vast amount of DWDM sales go to these domestic companies. Due to the high mix of companies in “others,” I did not shade those boxes, but in both North America and China the majority of “others” are domestic companies as well.
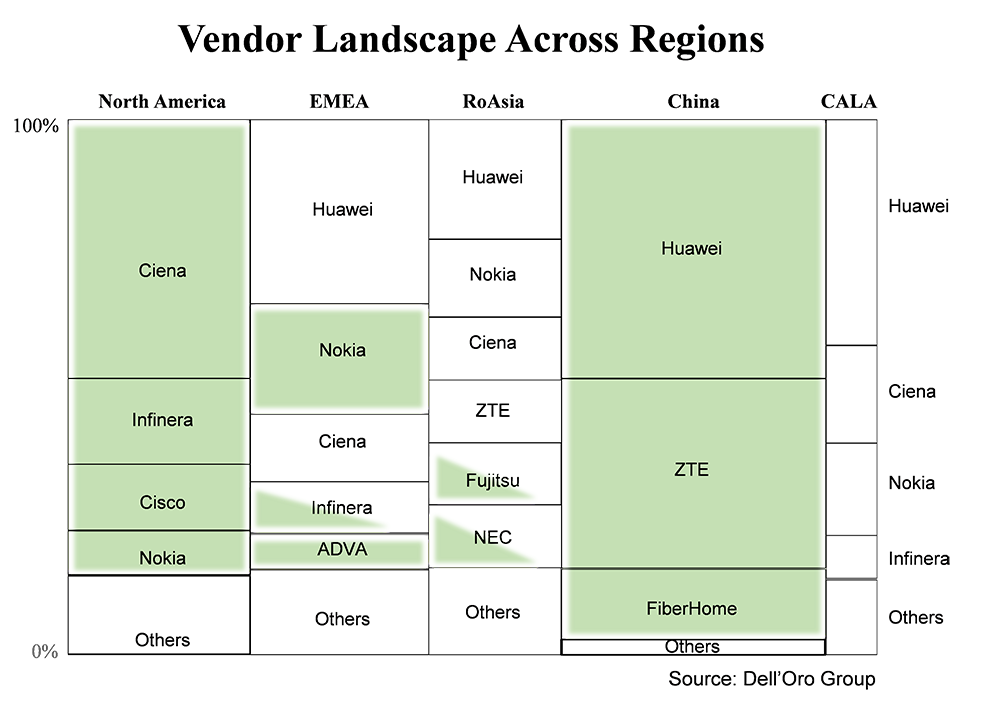
What may be of interest is the non-shaded boxes. The reason is that after the U.S. placed restrictions on ZTE in 2018 and recently Huawei, service providers in the regions with a large number of non-shaded boxes (non-domestic vendors) are increasingly concerned with equipment supply. As a result, service providers are looking to de-risk by reducing dependence on any one supplier as well as increasing the consideration of local suppliers. In many ways, this will be good for the smaller companies that are based in the local regions such as Tejas in India, Padtec in CALA, and PacketLight in EMEA. However, in the vein of limiting risk, the largest service providers will likely continue to purchase most equipment from the larger DWDM manufacturers that have the scale and technology to support their future endeavors.
Dynamic State of the Industry
Perhaps the best way to describe the state of the optical WDM equipment industry this year is “dynamic.” I say this because unlike in the past when industry forces were relatively the same from year to year, new forces emerged in the optical industry this year that may dynamically reshape it. Specifically, the new forces I am referring to are the higher viability of product substitution with IPoDWDM enabled by 400ZR in a QSFP-DD plug and a change in customer behavior created by U.S. government actions on Chinese manufacturers that could alter the vendor landscape in certain regions over time.